Monday, October 5, 2009
Week 6: The results are in!
Sunday, October 4, 2009
Week 6: Soybean pests and estimating % damage.

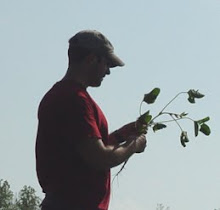
Part I. Recall, you were asked to select a single soybean plant from the late and early-planted soybean and examine it. Based on what you observed and what others were reporting, would you spend more time sampling these particular fields? If so, which fields (early vs late) and why? What types of feeding did you observe on these plants? Based on the lecture, what insects could have caused some of these feeding patterns? Was damage the same between early and late planted? Assuming you sampled 29 more plants and all samples showed the exact same damage (not always the case), what treatment (if any) would you recommend? Add photos (your own or ones you find on the web) of defoliation, pod damage, stem damage, etc. that you observed. (Also, a point to anyone who can identify the insect in the picture above.)
Part II. The second objective from last week's lab was to estimate the amount of damage caused by various defoliating pests found in soybean. It is nearly impossible to quantify the damage using absolute methods for management applications. In stead, qualitative methods are often deployed to reduce time spent sampling. However, there are issues with using such techniques and you were asked to explore some of those in this lab. Recall, you were asked to estimate the percent damage for each leaflet that was collected from a field at Ashland Bottoms Research Farm. Record your estimate for each leaflet in the table below. There were a total of 60 samples. We're still in the process of calculating the total damage per leaf; this is not a quick process. To accomplish this, we first scan the leaf as a grayscale image:

We then convert this image into a black/white TIFF, which allows us to analyze it using ScionImage, which is a freeware program that allows us to calculate areas based on pixel ratios.

Once the image is in black and white, we can estimate the total damage by inverting the image (black now becomes white) and highlighting the damaged areas and calculate the area using the software. Next, we use the eraser tool and delete the damaged areas in the image. This allows us to select the area of the whole leaf, which is then used to calculate the percent damage (area damaged/total area*100). So, you can see why we're still working on this! Remember, most of you finished estimating all leaves within 5-10 minutes! This is why we estimate damage in the field, but for research purposes this is not appropriate. There is too much variability between sampler, etc., to rely on subjective estimates. Don't worry, you'll be asked to talk about the results from this part of the lab in next week's blogbook.
For this week and this part of the lab only, you're off the hook! However, you still need to answer the questions from Part I above to get all 5 points. Also, upload images of soybean damage, either your own or ones you find on the internet.
Subscribe to:
Posts (Atom)